
Contactless Payment Statistics 2026: Restaurants, Tap to Pay & Cash
The Duckhub team builds QR menu and online ordering software, run through your own AI assistant (ChatGPT, Claude), used by cafes, bars, and restaurants. We write practical guides based on what we see working across thousands of published menus.
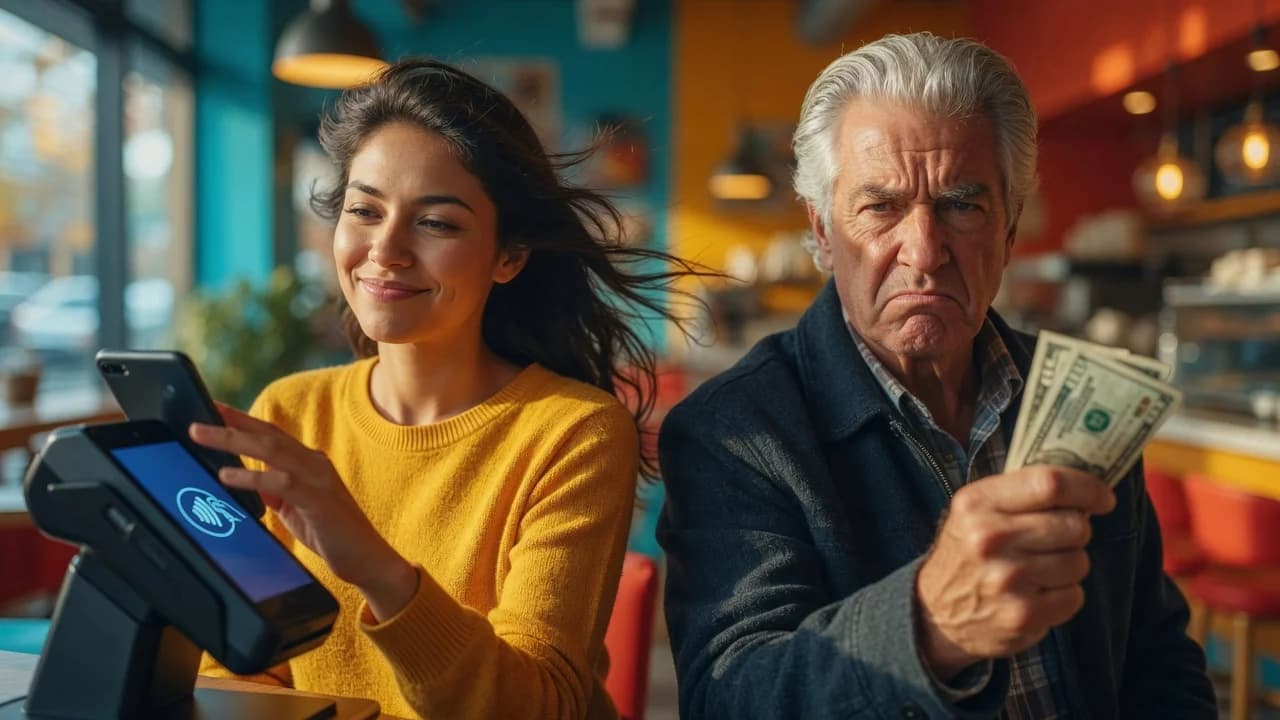
Contactless payment statistics for 2026 tell a story of quiet completion: tap to pay has passed 60% of in-person US Visa transactions and roughly 80% internationally, and in Europe contactless is now 81% of in-person card payments. For restaurants, the interesting data has moved past “will guests tap” to the operational layer — pay-at-table, phone-as-terminal, digital tipping, and the legal reality that cash cannot be dropped. This page compiles 35+ verified statistics, favoring central-bank sources over vendor decks.
The honest tension in the data: digital dominates growth while cash refuses to die — 14% of US payments and a legally protected option in a dozen jurisdictions. This hub is part of our restaurant data series anchored by the restaurant technology statistics pillar.
TL;DR: the payment numbers that hold up
- US tap to pay crossed the majority line: 60%+ of Visa’s in-person transactions (fiscal 2025), up from under 1% in 2017; ~80% internationally.
- Europe is further along: contactless is 81% of euro-area in-person card payments by number, 65% by value (ECB, H2 2024).
- Cash is declining, not dying: 14% of US consumer payments by count, stable at ~7 cash payments per person per month since 2020 (Federal Reserve); 52% of euro-area POS transactions (ECB SPACE).
- Cashless-only is illegal in much of the US: NY State, Massachusetts, NJ, Philadelphia, San Francisco, Chicago and more require accepting cash.
- SoftPOS is the small-venue breakthrough: Visa’s Tap to Phone grew 200% year over year; Juniper projects 6M → 34.5M merchants by 2027.
- Digital tipping stabilized: 19.3% average at full-service, 15.8% flat at quick-service for six quarters (Toast, Q1 2026).
How widespread is contactless payment now?
Tap to pay is the default in-person payment method in most advanced economies, and the US finally joined the club. Visa’s own reporting puts contactless at about 80% of face-to-face transactions internationally, and US adoption crossed 60% of in-person Visa transactions in fiscal 2025 — from under 1% in 2017 and 28% in 2022.
Europe’s central-bank data is the cleanest available. Per the ECB’s payments statistics for H2 2024, contactless card payments grew 15.5% year over year to 29.5 billion transactions, reaching 81% of all in-person card payments by number (65% by value).
| Statistic | What it measures | Source (date) | Quality |
|---|---|---|---|
| 60%+ | Share of in-person US Visa transactions that are tap to pay (fiscal 2025) | Visa via 451 Research (2025) | Payment network |
| ~80% | Face-to-face transactions internationally (ex-US) that are tap to pay | Visa via PYMNTS (2024) | Payment network |
| 81% / 65% | Contactless share of euro-area in-person card payments, by number / by value | European Central Bank (H2 2024) | Government (central bank) |
| +15.5% | Year-over-year growth of euro-area contactless payments (to 29.5B) | European Central Bank (H2 2024) | Government (central bank) |
For restaurants the operational meaning is speed: a tap clears in seconds versus chip insertion, and at quick-service volumes those seconds compound into real throughput during peak hours. The payment step has effectively stopped being a bottleneck — the remaining friction sits earlier, in ordering, which is why the online ordering data matters more to revenue than the tap itself.
Cash decline: the honest version
Cash is losing share and refusing to disappear — both facts are well documented. The Federal Reserve’s 2025 Diary of Consumer Payment Choice puts cash at 14% of US consumer payments by count — but the average consumer still makes about seven cash payments a month, a figure unchanged since 2020. In the euro area, the ECB’s SPACE study counts cash at 52% of point-of-sale transactions by number (down from 59% in 2022).
| Statistic | What it measures | Source (date) | Quality |
|---|---|---|---|
| 14% | Cash share of all US consumer payments by count (2024 data) | Federal Reserve Diary (2025) | Government (central bank) |
| ~7 / month | Average cash payments per US consumer — stable since 2020 | Federal Reserve Diary (2025) | Government (central bank) |
| 52% (from 59%) | Cash share of euro-area POS transactions by count, 2024 vs 2022 | ECB SPACE study (Dec 2024) | Government (central bank) |
| 7% (from 4%) | Mobile-app share of euro-area POS payments, 2024 vs 2022 | ECB SPACE study (Dec 2024) | Government (central bank) |
And the legal layer makes “fully cashless” a non-option across much of the US. Jurisdictions requiring businesses to accept cash include Massachusetts (since 1978), New Jersey (2019), Philadelphia (2019), San Francisco (2019), Rhode Island (2019), Washington D.C. (2020), Colorado and Connecticut (2021), Delaware (2022), Chicago (2024), and New York State (effective 2026) — with fines for refusal. The takeaway for operators: build the digital-first stack, but keep a compliant cash lane; the hybrid requirement is legislative, not just generational.
Mobile wallets and the generational curve
The phone is becoming the wallet, one age cohort at a time. The Federal Reserve’s diary data shows US consumers averaged 11 mobile-phone payments per month in 2024, up from 4 in 2018 — and adults aged 18–24 already make 45% of all their payments by phone. In the euro area, mobile apps’ share of POS payments nearly doubled in two years (4% → 7%).
For restaurants this cohort effect is a planning horizon, not a trend to debate: the guests aging into peak spending years treat biometric tap-by-phone as the normal way to pay. Terminals, tipping flows, and loyalty capture built around physical cards will feel dated within one equipment cycle. It is the same demographic gradient documented across QR menu willingness — where the National Restaurant Association found 46–48% of diners would already pay the check by QR if offered.
Tap to Phone / SoftPOS: the small-venue breakthrough
The fastest-growing payments technology for small food businesses is the one with zero extra hardware. SoftPOS (marketed as Tap to Phone, or Tap to Pay on iPhone/Android) turns an ordinary NFC smartphone into a certified card terminal. Per Visa’s announcement, Tap to Phone adoption grew 200% year over year globally, with the top three markets (US, UK, Brazil) growing a combined 234%. Juniper Research projects merchants using SoftPOS to grow from 6 million in 2022 to more than 34.5 million by 2027 (+475%).
| Statistic | What it measures | Source (date) | Quality |
|---|---|---|---|
| +200% | Year-over-year global growth in Visa Tap to Phone adoption | Visa (2025) | Payment network |
| +234% | Combined growth in the top three markets: US, UK, Brazil | Visa (2025) | Payment network |
| 6M → 34.5M | Merchants using SoftPOS, 2022 → 2027 projection (+475%) | Juniper Research (2023) | Independent (analyst) |
The restaurant relevance is concentrated at the small end: food trucks, market stalls, pop-ups, patio service, and single-location cafes historically priced out of extra terminals. A server’s phone becomes the pay-at-table device; a truck’s phone becomes the register. Combined with a QR menu and direct ordering, a complete digital front-of-house now runs on hardware the operator already owns.
Payments in the dining room: pay-at-table, QR, and tipping
The restaurant-specific payment story is about collapsing the ordering and paying steps, not the tap itself. Independent restaurant-level payment-mix data is thin (most published breakdowns are vendor platform data — treat them as directional), but two well-sourced anchors stand out. First, demand-side willingness: the National Restaurant Association’s 2024 Technology Landscape Report found 46% of full-service and 48% of limited-service diners would pay by QR code if offered. Second, the tipping layer, where Toast’s quarterly platform data (~171,000 US locations, card and digital tips) gives the best longitudinal series available.
| Statistic | What it measures | Source (date) | Quality |
|---|---|---|---|
| 46% / 48% | Full-service / limited-service diners who would pay by QR if offered | National Restaurant Association (2024) | Independent (association) |
| 19.3% | Average full-service tip on card/digital payments, Q1 2026 | Toast (Q1 2026) | Vendor (disclosed) |
| 15.8% | Average quick-service tip — flat for six consecutive quarters | Toast (Q1 2026) | Vendor (disclosed) |
| 18.8% | Overall average restaurant tip across formats | Toast (Q1 2026) | Vendor (disclosed) |
The tipping numbers deserve a myth-check of their own: despite the loud “tip creep” discourse, average percentages have been strikingly stable — full-service hovering between 19.1% and 19.4% for two years. Digital prompts changed how often people tip (a screen with preset buttons converts far better than a jar) more than how much. For operators, preset choice architecture is effectively free revenue for staff — with the caveat that aggressive defaults at counter service visibly irritate guests without moving the QSR average, which has not budged in six quarters.
What do payments cost a restaurant?
Every payment method has a cost; they are just differently visible. Card acceptance costs roughly 2–3% of the transaction in processing and interchange — painfully visible on statements, and a major line against the median restaurant’s 2.8–4.0% pre-tax margin (see the profit margin statistics hub). Cash looks free but isn’t: counting, reconciliation, shrinkage, and transport all cost real labor.
How much cash handling actually costs is genuinely disputed, and honest writing says so: the IHL Group (an analyst firm frequently cited by payment vendors) has put the all-in cost of cash for restaurants above 15% of cash revenue, while the British Retail Consortium’s retailer surveys put direct cash costs as low as a fraction of a percent of turnover. The truth depends entirely on what you count (managerial time vs pure fees) and who is counting (vendors selling cashless benefit from big numbers). Practical read: neither method is free, digital costs are at least predictable, and the decision is usually made by guest preference and law rather than unit cost.
Disputed payment statistics you should not cite
Payments statistics suffer badly from aggregator recycling. Claims we checked and set aside:
| Popular claim | Why it fails | Use instead |
|---|---|---|
| “Contactless payments will exceed $10 trillion by 2027” | Aggregator forecast with no traceable firm or definition | Named-firm forecasts with scope stated |
| “80% of restaurant transactions will be cashless by 2026” | Sourced to a market-research abstract; no methodology visible | Fed (14% cash US) and ECB (52% cash EU) actuals |
| “The restaurant payments market is worth $X billion” | Published 2025 estimates range from ~$15B to ~$52B for the same market — a 3.5× definitional spread | A range with named firms, or skip the number |
| “Cash is dead” | Fed diary shows cash payments per consumer flat since 2020; a dozen US jurisdictions legally require acceptance | “Cash is a shrinking but stable and legally protected minority” |
| “62% of US in-person transactions are contactless” (precise) | Circulates via aggregator blogs attributing loosely to networks | Visa’s own “passed 60%” milestone framing |
The tell, as everywhere in this series: a precise-sounding number with no firm, date, or definition attached. Central banks publish this data properly — when a payments claim matters, the Fed and ECB links above are the primary sources to check.
The state of restaurant payments in 2026, in one honest paragraph
Payments in 2026 are a solved problem with unsolved edges. The tap won: 60%+ of US in-person transactions, 80% internationally, 81% of European card payments. The growth has moved to the seams — phones as terminals (200% a year), pay-at-table and QR flows that collapse ordering and settlement into one step, and tipping screens that quietly stabilized at 19% full-service. Meanwhile cash holds a stubborn, legally protected floor that makes hybrid acceptance mandatory. For operators the strategic conclusion is unglamorous: payment acceptance is table stakes; the margin and data live one layer up, in whose channel takes the order — covered in our online ordering statistics and the technology pillar.
The step before the tap is where restaurants win or lose the check. Duckhub handles it: a fast QR menu with photos and descriptions your own AI assistant can write, direct online ordering at 0% commission, and translations into 10+ languages for guests who’d rather scan than ask. The free Egg plan includes 70 products and 30 QR table codes; paid plans start at $10/month. More data and guides on the Duckhub blog.