
QR Code Menu Statistics 2026: 50+ Data Points on Use & Sentiment
The Duckhub team builds QR menu and online ordering software, run through your own AI assistant (ChatGPT, Claude), used by cafes, bars, and restaurants. We write practical guides based on what we see working across thousands of published menus.
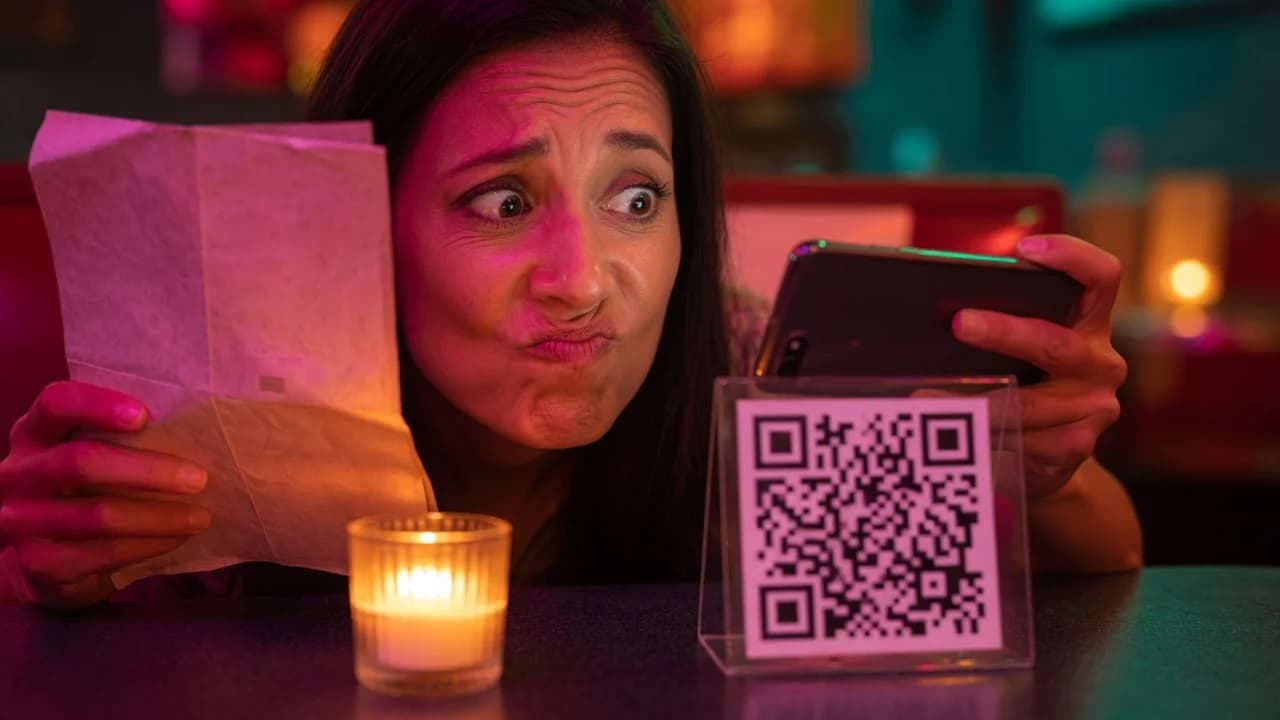
QR code menu statistics for 2026 point to one clear pattern: usage keeps climbing while preference stays with paper. Ipsos found 65% of Americans have scanned a QR menu, up from 42% in 2022. Yet Toast’s blind survey found only 1% of diners prefer QR menus and 81% prefer physical ones. Usage and preference are not the same thing.
That gap is the reason this topic is so full of contradictory numbers. This page compiles more than 50 verified data points from independent research firms, government agencies, academic studies, and vendor surveys with disclosed methodology. Every figure is tagged by source quality, and a dedicated section lists the popular claims you should not cite.
TL;DR: the QR menu numbers that hold up
- Usage is high and rising. 65% of U.S. adults have used a QR menu (Ipsos, July 2025), up from 42% in August 2022.
- Preference still favors paper. 81% of diners prefer a physical menu; just 1% prefer QR codes (Toast blind survey, 850 adults, September 2024).
- The “78% enjoy QR menus” claim is a denominator error — it traces to a “benefits” question and a users-only subgroup, not a preference of all diners.
- ROI claims are mostly vendor-sourced. Printing savings are real; the “+20–30% sales” figure has no strong independent evidence.
- QR payments are the real growth engine: $5.4 trillion in 2025, projected to top $8 trillion by 2029 (Juniper Research).
- Security is now an operational issue: QR phishing rose 146% in a single quarter of 2026 (Microsoft Security).
The honest 2026 summary in one paragraph
QR menus in 2026 are widely used, often tolerated, sometimes liked in the right context, but still rarely preferred as the only option. Independent surveys agree that most diners can and do scan QR menus, especially younger ones, while preference measures still favor paper by a wide margin. The strongest business case is operational: lower reprint costs, instant updates, and faster payment, not a guaranteed sales lift. The most defensible reading is that QR codes failed as a full menu replacement but succeeded as a transactional tool.
Restaurants keep them because the unit economics work, and because the honest evidence supports a hybrid model: hand guests a physical menu for the dining experience, and use a table QR code for secondary tasks like specials, allergen detail, reordering, and paying the bill.
How many restaurants use QR code menus?
Restaurant-side adoption data is weaker than most articles admit. The clearest hard number remains from the pandemic transition: the National Restaurant Association reported that 50% of full-service operators added QR-accessible digital menus after March 2020. No recent, representative public study credibly answers what share of all restaurants offer QR menus in 2026, so treat precise “70% of restaurants” claims with caution.
The demand signal is stronger than the supply signal. In the National Restaurant Association’s 2024 Technology Landscape Report, most diners say they would use a QR menu if offered, even though far fewer say they prefer it.
| Statistic | What it measures | Source (date) | Quality |
|---|---|---|---|
| 50% | Full-service operators that added QR/digital menus since March 2020 | National Restaurant Association (2021) | Independent |
| 54% / 50% / 48% | Casual / fine / family-dining operators that shifted menus to digital-QR access | National Restaurant Association (2021) | Independent |
| 59% | Full-service diners who would access the menu by QR if offered | National Restaurant Association (2024) | Independent |
| 48% | Full-service diners who would place an order by QR if offered | National Restaurant Association (2024) | Independent |
| 46% | Full-service diners who would pay the check by QR if offered | National Restaurant Association (2024) | Independent |
| 57% / 52% / 48% | Limited-service diners who would access / order / pay by QR if offered | National Restaurant Association (2024) | Independent |
| 88% | Operators who would consider fully replacing physical menus with digital (a 2020–21 peak sentiment) | Square / Wakefield Research (2021) | Vendor |
The pandemic surge is well documented. What is missing is a credible 2024–2026 churn study showing how many restaurants kept, partly kept, or dropped QR menus. Public reporting shows meaningful reversal to paper and hybrid setups, but no representative rate. That is a genuine data gap, not a number to guess at. If you are still setting one up, our guide to making a QR code menu covers the practical steps.
Do people actually use QR code menus?
Yes, and usage keeps climbing. The strongest independent trendline comes from the Ipsos Consumer Tracker: the share of Americans who have ever used a QR menu rose from 42% in August 2022 to 57% in June 2023 to 65% in July 2025 (U.S. sample of 1,083 adults, credibility interval about ±5.1 points). Other independent surveys land in a similar range for menu-specific scanning.
| Statistic | What it measures | Source (date) | Quality |
|---|---|---|---|
| 42% → 57% → 65% | Americans who have ever used a QR menu (2022 → 2023 → 2025) | Ipsos Consumer Tracker (July 2025) | Independent |
| 48% | U.S. adults who used a QR code to view a restaurant menu in the prior year | TEAM LEWIS (September 2024, n=1,000) | Independent |
| 68% | U.S. adults who used a QR code for any purpose in the prior year | TEAM LEWIS (September 2024) | Independent |
| 49% | Consumers who had used a QR code to pull up a menu | Datassential (2022) | Independent |
| 94M → 102.6M | U.S. smartphone QR scanner users, 2023 projected to 2026 | EMARKETER (March 2023) | Independent |
The takeaway: scanning a menu is now a normal, majority behavior. But “have used” is a low bar. The moment you ask whether people like the experience or prefer the format, the numbers move sharply in the other direction.
Do diners prefer QR menus or paper menus?
Paper still wins preference by a wide margin. This is the most confused area in the data, because four different measures get collapsed into one headline. Usage (“have you scanned one?”), willingness (“would you use it?”), liking (“do you like it?”), and preference (“which do you actually prefer?”) have different denominators and different answers. When diners are asked to pick a format, physical menus dominate.
| Statistic | What it measures | Source (date) | Quality |
|---|---|---|---|
| 81% | Diners who prefer a physical menu | Toast blind survey (850 U.S. adults, September 2024) | Vendor (disclosed) |
| 1% | Diners who prefer QR codes | Toast blind survey (September 2024) | Vendor (disclosed) |
| 37% | QR-menu users who agree “I like the experience of using digital menus” (down from 45% in 2023) | Ipsos (July 2025, users n=645) | Independent |
| 58% | QR-menu users who “would like to go back to paper menus” (up from 51% in 2023) | Ipsos (July 2025) | Independent |
| 71% | QR-menu users glad some restaurants went back to paper menus | Ipsos (July 2025) | Independent |
| 39% | QR-menu users who “hope the use of QR codes continues” (down from 43% in 2023) | Ipsos (July 2025) | Independent |
| 47% | Consumers not comfortable using QR to view, order, and pay (up from 43% three months earlier) | William Blair (April 2023) | Independent |
| 26% | Top Toast complaint: text on the phone is too small to read | Toast (September 2024) | Vendor (disclosed) |
| 28% | Top TEAM LEWIS complaint: slow loading | TEAM LEWIS (2024) | Independent |
Two things stand out. First, liking is falling even as usage rises: the Ipsos “like the experience” number dropped from 45% (2023) to 37% (2025) among users. Second, the complaints are specific and fixable — small text, slow loads, unreliable pages — not vague dislike. A well-built menu that loads fast and reads clearly answers most of them, which is exactly why PDF menus behind a QR code perform worse than a real mobile web page.
The “78% enjoy QR code menus” myth, explained
The viral “78% of customers enjoy QR code menus” claim is not a real preference statistic. It is a denominator error amplified by vendor blogs, often misattributed to a non-existent Eater survey. Traced back, it collapses two unrelated findings into one misleading headline, and it directly contradicts the best independent polling.
Here is what the number actually appears to come from:
- Square’s 2022 trend materials, where the underlying point was that roughly 78% of customers said there are benefits to digital menus — later rephrased in sponsored coverage as “78% enjoy the benefits of ordering with QR codes.” Seeing a benefit is not the same as preferring the format.
- Datassential’s 2022 result that 78% of Millennials who had already used QR codes liked them. That is a users-only subgroup of one generation, not all diners.
Set against Toast’s finding that 1% of diners prefer QR codes, the “contradiction” dissolves once you separate the denominators. A diner can agree QR menus have benefits, and even enjoy using one, while still preferring paper when asked to choose. Among the general public, paper preference is the consistent result across Toast and Ipsos.
Bottom line: if you see “78% enjoy QR menus” cited as proof diners prefer digital, discard it. The accurate framing is that usage has risen while preference remains overwhelmingly physical.
QR code menu statistics by age and generation
Younger diners use QR menus far more, but do not necessarily prefer them. A persistent myth holds that Gen Z inherently wants digital menus. The data shows younger diners are more willing and more capable, yet paper preference cuts across every generation. The clearest split is in willingness and past usage, not in preference.
| Statistic | What it measures | Source (date) | Quality |
|---|---|---|---|
| 69% / 78% / 66% / 30% | Full-service diners (Gen Z / Millennial / Gen X / Boomer) willing to access a menu by QR | National Restaurant Association (2024) | Independent |
| 58% / 65% / 52% / 16% | Same generations willing to pay the check by QR | National Restaurant Association (2024) | Independent |
| 68% vs. 22% | Gen Z vs. Boomers who had used a QR code to pull up a menu (a 46-point gap) | Datassential (2022) | Independent |
| 90% | Diners aged 55+ who prefer a physical menu | Toast (September 2024) | Vendor (disclosed) |
| 65% | Consumers aged 60+ not comfortable using QR to view/order/pay | William Blair (April 2023) | Independent |
| 91% / 78% | U.S. smartphone ownership: all adults / adults 65+ | Pew Research Center (2025) | Independent |
The accessibility angle matters here. Older diners hold outsized disposable income, and roughly one in five U.S. adults over 65 does not own a smartphone (Pew Research Center, 2025). A QR-only setup with small fonts and a slow page can push away a restaurant’s highest-spending guests. The safe pattern is optional, mobile-optimized, and always backed by a paper alternative.
Do QR code menus increase sales? ROI and cost savings
The ROI evidence is narrower than vendor marketing implies. Printing savings and faster updates are credible and repeatable. Large, generalized claims about sales lift are almost entirely vendor-sourced. There is no strong independent, representative evidence that QR menus routinely increase sales by 20% to 30%; academic work finds menu design has a medium effect on intention but only a small effect on actual purchase.
| Statistic | What it measures | Source (date) | Quality |
|---|---|---|---|
| $4,000–$5,000/yr | Printing savings per location for one operator (who later returned to paper after complaints) | Axios Twin Cities (April 2023) | Independent (anecdotal) |
| Medium / small effect | Menu design’s effect on intention (medium) vs. actual purchase (small), across 53 papers and 16,522 participants | Ip & Chark meta-analysis (2023) | Independent (academic) |
| β = 0.56 | Effect of menu informativeness on perceived convenience of online ordering | Brewer & Sebby (2021) | Independent (academic) |
| Diminished loyalty | QR menus reduce customer loyalty vs. traditional menus, mediated by “perceived inconvenience” | Hewage et al., Journal of Retailing and Consumer Services (2024) | Independent (academic) |
| Positive impact | QR menus improved service quality and satisfaction in a 508-person casual-dining study | Yiğitoğlu et al., MDPI (2025) | Independent (academic) |
| +35% sales in 30 days | Sales lift after adding QR self-serve ordering | Square, sponsored (2022) | Vendor |
The honest phrasing for any citable claim: digital menus can support upselling and improve convenience, information depth, and operational flexibility, but the size of any sales effect is highly context-dependent and rarely independently audited. Any lift depends on active menu engineering — photos, descriptions, upsell prompts — not on the QR code itself. A text-only PDF behind a code tends to reduce order value as guests skim past appetizers and desserts.
QR code menu adoption around the world
Global adoption is asymmetric, driven by payment infrastructure more than by hospitality trends. Where QR codes already power everyday payments, scanning at a table feels natural; where tap-to-pay dominates, it feels like an extra step. Precise country-level menu-adoption percentages are mostly vendor estimates, so the more reliable signal is the payment rails underneath.
| Statistic | What it measures | Source (date) | Quality |
|---|---|---|---|
| $5.4T → $8T+ | Global QR payment value, 2025 projected to 2029 (~50% growth) | Juniper Research (February 2025) | Independent |
| +62% / +151% | QR payment growth in 2025: volume / value, year over year | Worldpay Global Payments Report (2026) | Independent |
| 2.2 billion | People worldwide actively using QR codes (~29% of smartphone users) | Juniper Research (2026) | Independent |
| Higher in Asia | Regions with dominant QR payment rails (WeChat, Alipay, UPI, PIX) show far higher table scanning | Multiple market analyses (2026) | Vendor estimate |
Treat regional menu-adoption percentages you see elsewhere as directional at best. No transparent, representative study currently pins down QR menu prevalence by country in 2026. What is solid is the payment story: Juniper Research projects QR payment value will grow about 50% by 2029, and that scanning “muscle memory” carries directly into whether diners will comfortably scan a menu.
QR code menu security: the “quishing” risk
QR phishing (“quishing”) is now a live operational risk for restaurants, not a theoretical one. Because a QR code hides its destination until scanned, criminals print fraudulent stickers over legitimate menu codes, and diners who have been conditioned to scan without thinking are easy targets. Per Microsoft Security, attack volumes are climbing steeply.
| Statistic | What it measures | Source (date) | Quality |
|---|---|---|---|
| 7.6M → 18.7M | QR phishing attacks, January to March 2026 (+146% over the quarter) | Microsoft Security (April 2026) | Independent |
| 83% / 68% | Malicious Microsoft 365 documents / PDFs that contained QR phishing codes | Barracuda (2025) | Independent |
| 73% | Americans who scan QR codes without verifying the destination URL first | NordVPN (2025) | Independent |
| 2022 onward | When the FBI began warning about QR-code scams involving financial loss | FBI / IC3 advisories (2022–2025) | Independent |
For restaurants, the practical implications are concrete: use visibly branded codes, check periodically for sticker-over-sticker tampering, make sure the landing page clearly matches your venue and domain, and train staff to confirm authenticity. A hosted menu on a recognizable subdomain (for example, yourvenue.duck-hub.com) is easier for guests to trust than a random shortened link.
Disputed QR menu statistics you should not cite
Several of the most-shared QR menu statistics do not survive scrutiny. They circulate through vendor blogs and content farms without a traceable primary source, or they misrepresent what was actually measured. Use the corrected framing instead.
| Popular claim | Why it fails | Use instead |
|---|---|---|
| “78% of customers enjoy QR code menus” | Traces to a “benefits” question and a users-only Millennial subgroup; contradicts Toast’s 1% preference finding | “Usage has risen, but preference remains overwhelmingly physical” |
| “QR menus increase sales by 20–30%” | Found only in vendor blogs and sponsored content; no independent, representative confirmation | “Digital menus can support upsells, but large generalized sales-lift claims lack independent evidence” |
| “70% of restaurants now use digital menus” | Repeated widely with no public, methodologically transparent primary report | “Pandemic-era adoption was high, but recent representative prevalence data is sparse” |
| “88% of diners prefer paper” as a current benchmark | Widely cited via Technomic/WSJ but the primary methodology is not publicly accessible | Prefer Toast (81% prefer physical) and Ipsos (58% of users want paper back) |
| “QR menus are universally good for accessibility” | QR-only setups can exclude diners without accessible devices, battery, or screen-reader-friendly pages | “QR menus help accessibility only when built accessibly and offered alongside alternatives” |
The pattern across all five: someone measured something narrow, and the internet rounded it up into a sweeping claim. When you cite QR menu data, name the source, the date, and the exact denominator.
What the honest evidence says in 2026
QR menus survived the pandemic as a practical tool, not as the format diners prefer. The evidence dismisses the idea that any generation, including Gen Z, prefers digital menus over physical ones. It also dismisses the idea that QR menus failed outright. The accurate reading sits in between: they are widely used, frequently tolerated, occasionally liked in the right context, and still rarely preferred as the only option.
The winning configuration is the hybrid model. Give guests a physical menu for the core dining experience, and offer a table QR code clearly labeled for secondary jobs — daily specials, allergen and ingredient detail, wine lists, reordering, and paying the bill. Technology in hospitality works best when it removes friction without removing the human part of the meal. On that reading, the QR code lost the menu-replacement argument and won the operational one.
For restaurants deciding what to build, the practical implications are consistent: keep QR optional, make the page fast and readable, host it as a real indexable web page rather than a PDF, and never force a phone on a guest who does not want one. Those choices answer nearly every complaint in the independent data. Our roundup of the best digital menu software compares the platforms that get this right, and our guide to digitizing a restaurant menu walks through the format choices.
Building your own QR menu? Duckhub hosts it as a fast, indexable web page — not a PDF — so it answers the complaints in the data above. The free Egg plan includes 70 products and 30 QR table codes; paid plans start at $10/month, with 0% commission on orders on every tier. Browse more guides on the Duckhub blog.