
Duckhub Blog
Guides, news and comparisons to help your restaurant grow online.
- Guides
A la carte or prix fixe? The menu format you pick decides your food cost
A la carte prices every dish separately and hands the guest maximum choice. Prix fixe, table d'hote and tasting menus trade that choice for predictability: you know what the kitchen will cook before service starts. This guide gives the dictionary definitions, an eight-criteria comparison table, the honest answer on whether prix fixe and table d'hote are actually different, and what US fee-disclosure law does and does not require on a fixed-price menu.
By Duckhub TeamAug 10, 202612 min read - Guides
Restaurant terms and kitchen slang: the glossary we wish we'd had on day one
Restaurant vocabulary is six separate vocabularies wearing one coat: floor shorthand, kitchen commands, menu formats, bar tiers, French classical terms, and accounting metrics. This glossary separates them, gives every metric its exact formula, settles the legal difference between a service charge and a tip, and corrects the definitions competing glossaries routinely get wrong.
By Duckhub TeamAug 5, 202622 min read  News
NewsGoogle's April 2026 Review Policy: Staff-Name Requests and Review Quotas Now Banned
In mid-April 2026 Google tightened its Maps review rules: staff review quotas and asking customers to mention an employee by name are now explicit violations, and the bans on review gating and on-site review kiosks were reinforced — with pre-publication screening backing enforcement. Combined with the FTC's fake-review rule ($51,744 per violation) and Google's 292-million-review purge, the message is uniform: any review program that filters, incentivizes, or scripts is now a liability.
By Duckhub TeamAug 1, 20264 min read News
NewsMcDonald's Bets on AI Drive-Thru Again: ArchIQ Passes 1 Million Orders at 90% Automation
Two years after shutting down its IBM drive-thru experiment, McDonald's is back with ArchIQ — a Google Cloud-powered voice AI unveiled at its 2026 convention. The numbers behind the retry: 1 million+ test transactions, roughly 90% completed without a human stepping in, bilingual English/Spanish ordering, and Google Edge Cloud hardware going into US restaurants ahead of a nationwide rollout targeted for 2027. The industry lesson: drive-thru AI didn't die in 2024 — it went back to engineering.
By Duckhub TeamAug 1, 20264 min read News
NewsSquare Turns On Restaurant Ordering Inside ChatGPT and Claude: Agentic Commerce Arrives
On July 1, 2026, Square switched on restaurant ordering inside ChatGPT and Claude: eligible US food & beverage sellers were auto-enrolled, AI assistants can read live menus and place orders routed into Square's ordering system, and the only cost is standard processing — no marketplace commission. With only 6% of restaurants taking orders via AI (NRA) and ~6 in 10 younger diners saying they'd order through an AI bot, the demand-readiness gap just became the industry's next race.
By Duckhub TeamJul 31, 20264 min read Guides
Restaurant Review Statistics 2026: How Online Reviews Drive Revenue & Choice
The review economy in verified numbers: 97% of consumers read reviews and 31% demand 4.5+ stars (BrightLocal 2026); one extra Yelp star causes 5–9% more revenue for independents (Harvard); an extra half-star makes prime-time sellouts 49% more frequent (Anderson & Magruder); ~16% of Yelp restaurant reviews are filtered as suspicious; and since October 2024 the FTC fines fake-review schemes $51,744 per violation. Plus: 89% expect owners to respond — and 50% are put off by templated replies.
By Duckhub TeamJul 31, 20268 min read Guides
Restaurant Food Waste Statistics 2026: How Much Restaurants Waste & What It Costs
Foodservice wasted 290 million tonnes of food globally in 2022 — 28% of all consumer-level waste (UNEP). US foodservice surplus runs ~12.5 million tons a year worth ~$104 billion (ReFED), yet the viral '30–40% of purchases' claim misreads a USDA economy-wide statistic — real kitchen waste is 4–10% of purchases, and ~70% of US restaurant waste happens on the plate, not in the kitchen. The strongest number in the niche: $7 saved per $1 invested in prevention (Champions 12.3).
By Duckhub TeamJul 30, 20269 min read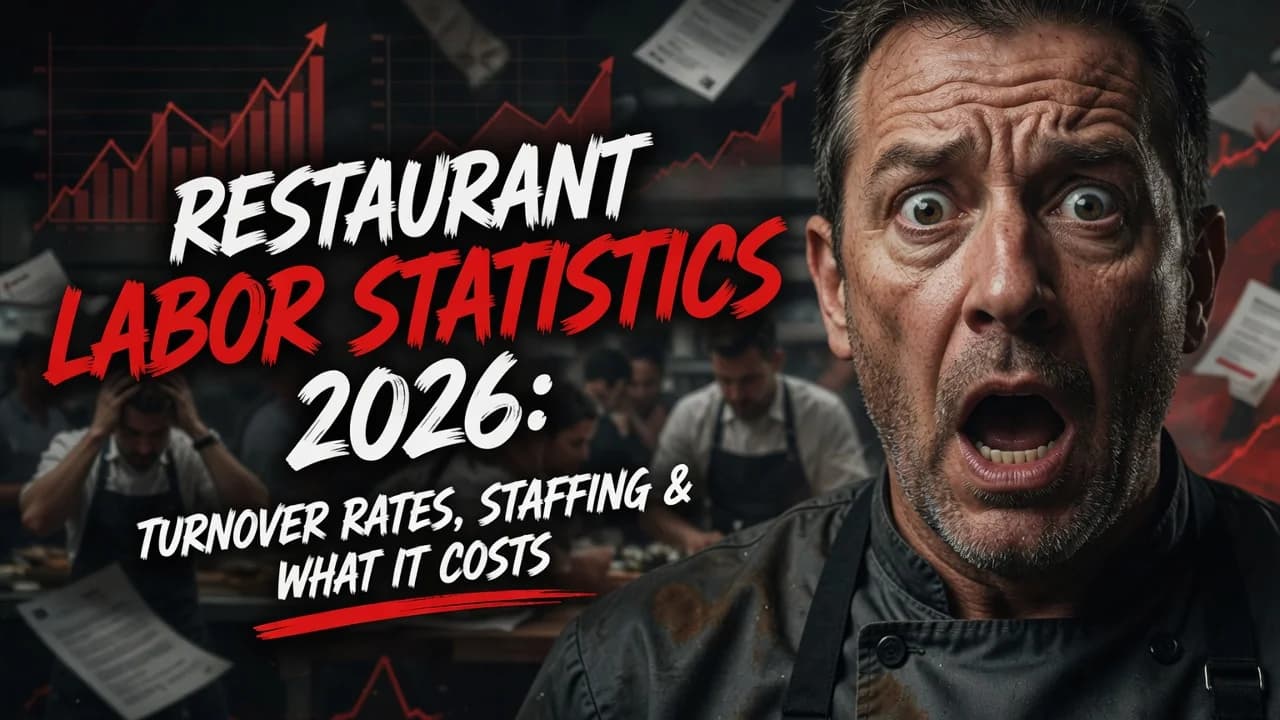 Guides
Restaurant Labor Statistics 2026: Turnover Rates, Staffing & What It Costs
The '75% restaurant turnover' stat everyone quotes is a methodology error waiting to happen — BLS 'separations' count events, not people, and include firings. The verified 2026 picture: hourly turnover runs ~110% in limited service and ~92% in full service (Black Box), the voluntary-quits wave has ended (BLS quits rate back to ~4.2%), understaffing collapsed from 78% of operators in 2021 to 22% in 2025 (NRA), and replacing one hourly worker costs $2,706 — a GM, $17,651.
By Duckhub TeamJul 30, 20269 min read Guides
Self-Service Kiosk Statistics 2026: Adoption, Order Value & the Hardware Question
Kiosks are winning QSR: ~450,000 self-ordering kiosks installed worldwide (Datos Insights), McDonald's runs 143,000+, Taco Bell hit 100% of US stores, and 61% of consumers want more kiosks (Tillster, up from 36% in 2023). But the viral '+20–30% order value' claim doesn't survive sourcing — the only academic field study measured kiosk checks 11% lower than cashier orders. The verified wins: throughput, labor reallocation, consistent upselling. QR ordering does the same job without hardware.
By Duckhub TeamJul 29, 20269 min read Guides
Restaurant Tipping Statistics 2026: Tip Fatigue vs What Diners Actually Leave
The tipping paradox in one page: complaints keep rising — 63% of Americans hold at least one negative view of tipping and 41% say tipping culture is out of control (Bankrate 2025) — yet actual tips are nearly flat, with full-service averaging 19.2% and quick-service 15.8% (Toast Q3 2025). Add Pew's 72% who say tipping is expected in more places, the $2.13 federal tipped wage unchanged since 1991, and the 13-million-ride study showing tip screens raise tips until defaults get greedy.
By Duckhub TeamJul 29, 20269 min read Guides
Menu Engineering Statistics 2026: What Data Really Says About Menu Psychology
Menu psychology is full of viral numbers nobody sources. The verified record: dropping the '$' sign raised spending ~8% (Cornell, 201 diners); eye-tracking shows diners read menus like a book (no 'golden triangle'); the '27% descriptive-labels lift' comes from a researcher who resigned after misconduct findings; 'photos sell 30% more' has no independent study. What holds up: the Stars/Plowhorses framework, choice-overload research (6–10 items per category), and a ~3x food-cost markup.
By Duckhub TeamJul 28, 202611 min read Comparisons
Restaurant POS Market Statistics 2026: Why Size Estimates Differ 6x
How big is the restaurant POS market? Depends who's counting: Mordor says $6.54B (software only), Grand View $22B+ (terminals), Fortune BI $38.6B (all industries). This hub maps each estimate to its definition and anchors the range with audited data: Toast alone booked $6.15B revenue on $195.1B payment volume in 2025, and Baird puts small-restaurant share at Clover 20%, Toast 17%, Square 13%. The real story: ~80% of POS revenue is payment processing, not software.
By Duckhub TeamJul 28, 202610 min read