
Restaurant Tipping Statistics 2026: Tip Fatigue vs What Diners Actually Leave
The Duckhub team builds AI-powered QR menu and online ordering software used by cafes, bars, and restaurants. We write practical guides based on what we see working across thousands of published menus.
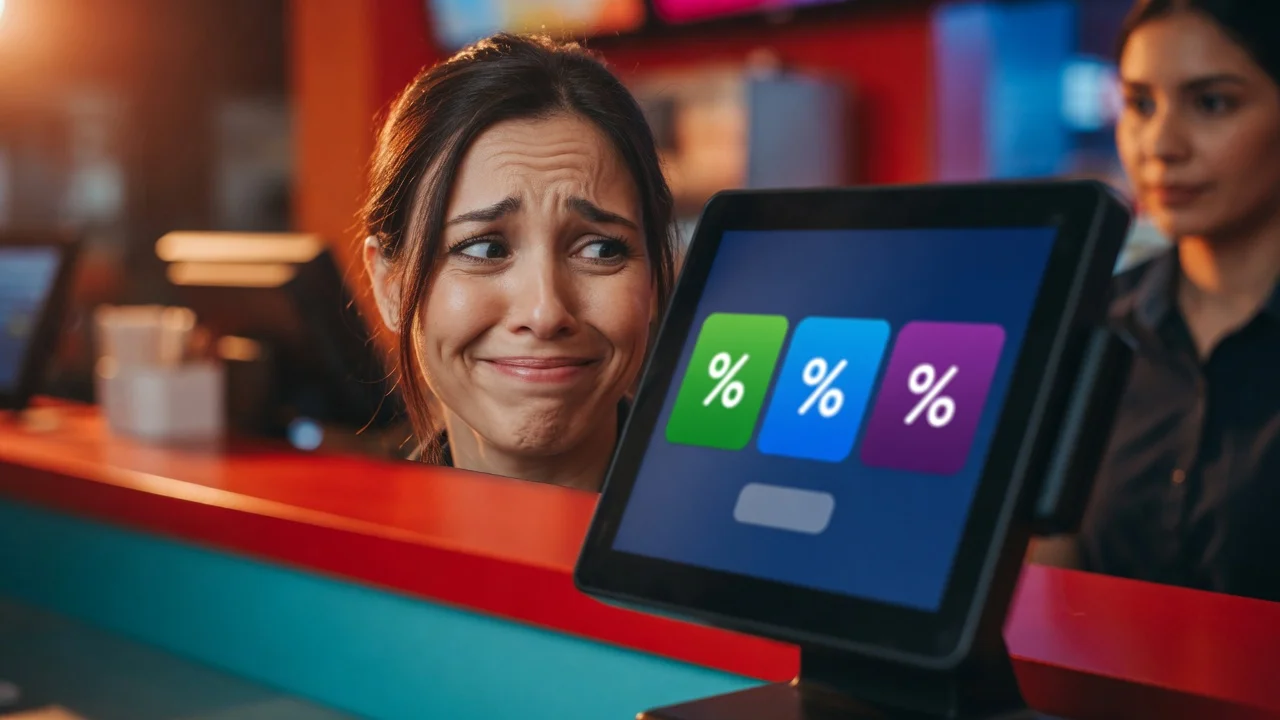
Restaurant tipping statistics tell a story of loud complaints and quiet consistency. Sentiment keeps deteriorating — 63% of Americans now hold at least one negative view of tipping and 41% say tipping culture is out of control — yet actual tips have barely moved: full-service restaurant tips averaged 19.2% in late 2025, within a point of where they’ve sat for seven years. This page tracks the verified numbers on averages, tip fatigue, demographics, tipped-wage law, and what digital tip screens actually do, with every figure tied to a named, dated source.
This hub is part of our restaurant data series, alongside contactless payment statistics and the restaurant industry statistics umbrella.
TL;DR: the tipping numbers that matter
- Full-service tips average 19.2%; quick-service 15.8% (Toast card data, Q3 2025) — FSR touched a seven-year low of 19.1% in Q2 2025, so the “collapse” is a rounding error.
- Across all restaurant transactions, Square measures 15.4% (2024) — lower than Toast’s FSR figure because it includes counter service, where many people tip little or nothing.
- 63% of Americans hold at least one negative view of tipping (up from 59%), 41% say tipping culture is out of control, and 38% are annoyed by preset tip screens (Bankrate 2025).
- 72% say tipping is expected in more places than five years ago (Pew, ~12,000 US adults) — but only about a third find it easy to know when or how much to tip.
- The federal tipped minimum wage is $2.13/hour, unchanged since 1991; seven states have abolished the tip credit entirely (DOL).
- Tips are ~23% of the average restaurant worker’s income (Square, 2024).
- Tip screens raise tips — until defaults get greedy: the 13-million-ride NYC taxi study found high defaults increase both tip amounts and the share leaving zero.
What is the average restaurant tip?
About 19% where a server waits on you, mid-15s at the counter, and roughly 10–15% for delivery. The most reliable running series is Toast’s quarterly tipping data, drawn from card and digital payments across its POS network: full-service restaurant tips averaged 19.2% in Q3 2025, a tick up from the seven-year low of 19.1% in Q2, while quick-service tips held at 15.8%. Square’s fall 2024 report, measuring every restaurant transaction on its network, puts the overall average at 15.4% (vs 15.5% in 2023).
| Context | Average tip | Source (date) |
|---|---|---|
| Full-service restaurants | 19.2% | Toast, Q3 2025 |
| Quick-service / counter | 15.8% | Toast, Q3 2025 |
| All restaurant transactions | 15.4% | Square, 2024 |
| Takeout / delivery orders | ~10–15% (consistently below dine-in) | Toast historical data; survey norms |
The two headline numbers aren’t in conflict — they have different denominators. Toast’s 19.2% is sit-down dining specifically; Square’s 15.4% blends in millions of counter transactions where tipping is optional and often skipped. Both series agree on the trend: essentially flat. Anyone claiming average tips have surged to 25% or crashed is quoting a number without a denominator.
Tip fatigue is real — in sentiment, not in behavior
Americans are increasingly annoyed by tipping and still tipping anyway; that gap is the defining tipping statistic of the decade. Bankrate’s 2025 tipping survey found 63% hold at least one negative view of tipping (up from 59% a year earlier): 41% say businesses should pay employees better instead of relying on tips, 41% say tipping culture has gotten out of control, and 38% are annoyed by pre-entered tip screens. Yet the same survey series shows the share who always tip at sit-down restaurants has stabilized after years of decline.
The scope creep behind the mood is well measured. Pew Research Center’s survey of nearly 12,000 US adults found 72% say tipping is expected in more places than five years ago — while only about a third say it’s easy to know whether (34%) or how much (33%) to tip in a given situation. That combination — more asks, less clarity — is what the headlines compress into “tipflation.”
The behavioral bottom line for operators: diners grumble about the system, but at tables with service, they keep paying the norm. The fatigue shows up at the margins — counter-service screens, takeout, and new contexts — not in the core sit-down tip.
Who tips more: demographics and geography
Older, higher-income diners tip more; Gen Z tips least; and the state-level spread is wide. The consistent survey findings: tipping generosity rises with age and income, men report slightly higher restaurant tips than women in most polls, and younger diners are far less attached to the habit across service contexts.
Geography is measured directly in POS data. Square’s 2024 state figures put Virginia (17.2%), Iowa (17.0%), and Delaware (16.8%) at the top of average restaurant tips and California (14.0%) and Hawaii (14.2%) at the bottom. Toast’s full-service series shows the same shape — Delaware consistently leads above 21%, California sits last around 17%. One structural pattern worth noting: several of the lowest-tipping states are ones where tipped workers already earn the full state minimum wage before tips, suggesting diners partially price that in.
The tipped minimum wage: $2.13 since 1991
Federal law still permits a $2.13/hour direct wage for tipped workers — a figure unchanged for over three decades. Under the Department of Labor’s rules, the “tip credit” lets employers count tips toward the $7.25 federal minimum; if tips fall short, the employer must top up the difference. Seven states — Alaska, California, Minnesota, Montana, Nevada, Oregon, and Washington — prohibit the tip credit entirely, requiring the full state minimum before tips, and several cities have moved the same way.
Whatever the policy debate, the dependence is factual: Square’s 2024 analysis finds tips make up about 23% of the average restaurant worker’s income nationally — over 30% in states like Wyoming, South Dakota, and Alaska. Claims about what happens after a jurisdiction eliminates its tip credit are the most contested numbers in this niche: advocacy groups on both sides circulate earnings and job figures with methodology disputes attached, so we treat all of them as unsettled rather than citable (see the disputed table below). For the cost side of the same ledger, see the labor-cost gap between profitable and unprofitable restaurants in our profit margin statistics.
What digital tip screens actually do
The best evidence says defaults work — and overreaching backfires. The landmark study is Haggag and Paci’s “Default Tips” (American Economic Journal: Applied Economics), analyzing over 13 million New York City taxi rides: suggested-tip defaults had a large positive effect on tip amounts, but when riders were shown higher default menus, a significantly larger share chose to leave no tip at all. Translated to restaurants: preset buttons anchor most guests upward, and aggressive presets (25/30/35%) convert a visible minority into zero-tippers.
Survey data matches the mechanism. Bankrate finds 27% of Americans say they tip less when shown a preset tip screen (only a small minority tip more because of one), and 38% are simply annoyed by them. Meanwhile, in-person service continues to out-earn remote contexts — dine-in tips have historically run ~5 points above takeout/delivery in Toast’s data.
The practical calibration for operators using QR or kiosk checkout: keep defaults at the service-appropriate norm (not above it), always show a custom-amount option, and make skipping easy — the taxi data says a graceful opt-out increases total tips versus a guilt-trap design. Duckhub’s ordering checkout leaves tip prompts fully configurable for exactly this reason; the same restraint logic applies across the contactless payment stack.
Service charges and no-tip models: still an experiment
No reliable dataset yet shows how service-charge models perform at scale. Individual restaurants and a few chains have replaced tipping with fixed service fees or all-in pricing, and the documented failure mode is confusion: guests who see an automatic fee often assume it’s a tip (it legally may not be), and voluntary tipping collapses on top of it. Until someone publishes systematic outcomes, treat every “service charges increase/decrease revenue by X%” claim as anecdote. What is well documented is disclosure risk — several states now require clear labeling of mandatory fees, and mislabeled charges are a fast route to one-star reviews in a market where 31% of consumers demand 4.5+ stars.
Disputed tipping statistics: check the denominator
Tipping is a headline-driven niche, and several viral numbers don’t survive sourcing. The recurring offenders:
| Claim you’ll see quoted | Status | What the record shows |
|---|---|---|
| “The average tip is now 25%” | No source | No POS dataset shows this; Toast FSR = 19.2%, Square all-transactions = 15.4% |
| “90% of Americans think tipping is out of control” | Overstated | From a small vendor poll; Bankrate’s 1,000±adult survey puts “out of control” at 41% |
| “Tipping has collapsed since the pandemic” | False | Toast’s series shows FSR tips within ~1 point of their level since 2018 |
| “95% of customers tip when prompted digitally” | Unverified | Circulates without a traceable methodology; the verified default-effect evidence is the NYC taxi study |
| Post-tip-credit-elimination earnings/job losses (or gains) of X% | Contested | Advocacy-sourced on both sides with disputed methodology; no neutral consensus figure exists |
What this means for your restaurant
Tipping is stable where service is personal, fragile where it’s automated — so design your digital checkout with restraint. The data supports three operator moves: keep suggested tips at the norm for your service style rather than above it (high defaults measurably create zero-tippers), make the opt-out graceful, and never let a service charge masquerade as a tip. Sentiment is the thing to watch quarterly; behavior, so far, barely moves.
Duckhub sits in the layer where this plays out — QR menus and first-party online ordering with configurable, norm-calibrated tip prompts and 0% commission on orders. You can set one up free in about 5 minutes on the 30-day trial, and see how the rest of the payment stack is shifting in our contactless payment statistics hub.
All statistics verified against primary sources as of July 2026. Vendor POS data (Toast, Square) is labeled as such; surveys cited with sample sizes where disclosed. This page is refreshed quarterly — tipping sentiment data ages fast.