
Restaurant Marketing Statistics 2026: How Diners Find Restaurants Now
The Duckhub team builds QR menu and online ordering software, run through your own AI assistant (ChatGPT, Claude), used by cafes, bars, and restaurants. We write practical guides based on what we see working across thousands of published menus.
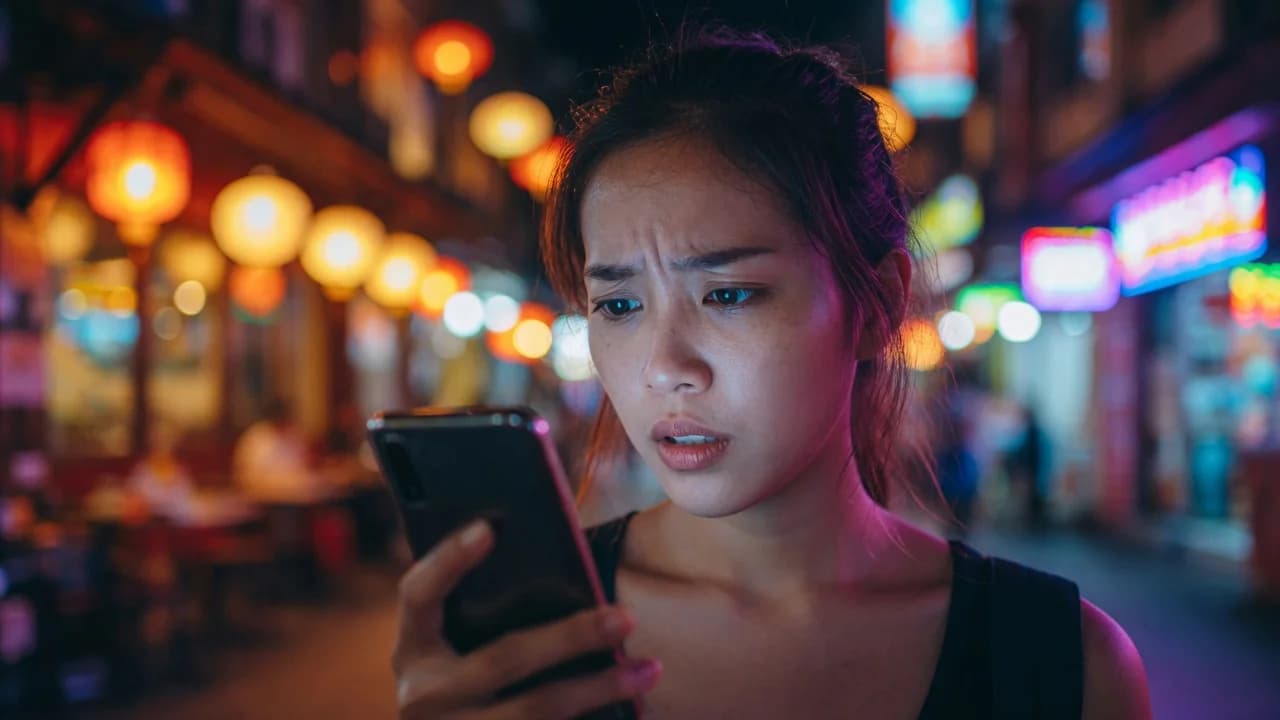
Restaurant marketing statistics tell one dominant story in 2026: discovery moved. The share of US consumers using AI tools for local business recommendations jumped from 6% to 45% in a single year, yet 83% of restaurant locations never appear in any AI recommendation. At the same time, 97% of consumers still read reviews, and a one-star rating increase lifts independent-restaurant revenue 5–9%. This page compiles the verified numbers across discovery, AI, reviews, social, loyalty, and spend — with every key figure linked to its primary source and the shaky ones flagged.
This is the marketing hub of our restaurant data series, anchored by the restaurant industry statistics umbrella and closely related to AI in restaurants statistics.
TL;DR: the restaurant marketing numbers that matter
- AI discovery grew 7.5x in one year: 45% of US consumers used AI for local business recommendations in 2026, up from 6% in 2025 (BrightLocal, n=1,002).
- 83% of restaurant locations never appear in AI recommendations — even though 86% have a Google presence (Uberall 2026 benchmark, vendor study).
- 22% of US diners have used AI to choose a restaurant (DoorDash 2026, n=3,001).
- Word of mouth is still #1 for discovering new restaurants at 38%, ahead of walk-bys (30%) and Facebook (27%) (Toast, n=1,466).
- 97% of consumers read reviews; 31% now insist on 4.5+ stars, up from 17% a year earlier (BrightLocal).
- One extra Yelp star = 5–9% more revenue for independent restaurants — a peer-reviewed causal finding, not a survey claim (Harvard Business School).
- 7% of guests can drive up to 50% of order volume, and loyalty members now account for 39% of all restaurant visits (Toast; Circana).
How do customers find restaurants in 2026?
Word of mouth remains the single biggest discovery channel, but digital channels now dominate everything after the first mention. In Toast’s blind survey of 1,466 US adults (October 2025, published in its 2026 guest discovery report), 38% named word of mouth as how they discover new restaurants, followed by simply walking or driving past at 30%. Social platforms collectively rival both: Facebook (27%), Instagram (15%), YouTube (15%), and TikTok (14%).
| Discovery channel | Share of US diners | Source |
|---|---|---|
| Word of mouth | 38% | Toast 2026 survey (n=1,466) |
| Walking / driving past | 30% | Toast 2026 |
| 27% | Toast 2026 | |
| 15% | Toast 2026 | |
| YouTube | 15% | Toast 2026 |
| TikTok | 14% (38% for Gen Z — their #1) | Toast 2026 |
| AI assistants (local recommendations, all businesses) | 45%, up from 6% in 2025 | BrightLocal 2026 (n=1,002) |
The generational split is the real headline inside that table. TikTok sits at 14% overall but is the #1 discovery channel for Gen Z at 38% — for the youngest diners, short video has replaced the search box. Meanwhile BrightLocal found Google’s share of local business discovery fell from 83% to 71% year over year as AI and social took share. No single channel owns discovery anymore; the funnel fragmented.
AI discovery: the fastest shift restaurant marketing has ever measured
The jump from 6% to 45% of consumers using AI for local recommendations is the steepest one-year behavioral change in the modern local-search record. BrightLocal’s 2026 consumer research (1,002 US adults, SurveyMonkey panel) found that 45% had used AI tools to find local business recommendations in the past year, versus 6% in the 2025 edition. ChatGPT led at 31% of consumers, Google’s AI Mode at 23%, and adoption peaked at 64% among 30–44 year olds. Notably, 42% of consumers said they trust AI recommendations as much as written reviews.
Restaurant-specific numbers land lower but point the same direction. DoorDash’s 2026 restaurant industry trends survey (3,001 US consumers) found 22% have used an AI tool such as ChatGPT or Gemini to choose a restaurant — searching by cuisine, occasion, or value. The same study found 75% of consumers are comfortable using AI for reservations, while only 28% of operators use AI for calls and customer service: a demand-supply gap measured in the same report.
Why 83% of restaurants are invisible to AI
Most restaurants have done nothing an AI engine can read. Uberall’s 2026 GEO benchmark — a vendor study, but the first to systematically test ChatGPT, Gemini, Perplexity, Copilot, and Google AI Overviews across 300+ QSR brands — found that 83% of restaurant locations never appeared in any AI recommendation, even though 86% maintained a Google presence.
Two structural facts explain the gap:
- AI answers are winner-take-all. Assistants typically name 3–5 restaurants per query and stop. There is no page two of a ChatGPT answer.
- Prompts are conversational, not keyword-shaped. Uberall found 79% of AI restaurant prompts are research-style questions (“best patio for a group of eight”) that keyword-optimized pages were never built to answer. What AI engines can parse is structured data: complete listings, consistent name-address-phone records, and menus published as indexable HTML rather than PDF images.
That last point is where menu infrastructure becomes marketing infrastructure. A menu that exists only as a PDF or a photo is invisible to the systems 22–45% of consumers now consult; a structured web menu with real dish names, prices, and dietary tags is machine-readable by default. This is the same dynamic we documented in our AI in restaurants statistics hub: the discovery layer moved to AI faster than restaurant data did.
Online review statistics: still the strongest proven revenue lever
Reviews remain the most rigorously proven marketing asset a restaurant has. BrightLocal’s Local Consumer Review Survey 2026 found 97% of consumers read reviews for local businesses, 41% “always” read them before choosing, and expectations are tightening sharply: 31% will only use a business rated 4.5 stars or higher, up from 17% a year earlier, and 74% only give weight to reviews written within the last three months. Recency now beats volume — a thick archive of old praise counts for little.
The revenue link is causal, not correlational. Michael Luca’s Harvard Business School study “Reviews, Reputation, and Revenue: The Case of Yelp.com” matched Yelp ratings to Washington State tax records and found a one-star increase in Yelp rating produces a 5–9% increase in revenue — driven entirely by independent restaurants. Chain locations showed no rating effect, which means reviews function as a substitute for brand trust. For independents, reputation is the brand.
The platforms are also policing harder. Google’s Maps content trust and safety enforcement blocked or removed over 292 million policy-violating reviews and 13 million fake Business Profiles in its latest reported year, up about 21% year over year. Tactics that used to be common — review gating, staff quotas, on-premises review kiosks — now sit explicitly against policy. The safe playbook is the boring one: ask every guest, respond to everything, and never filter.
Restaurant social media statistics: reach collapsed, video won
Follower counts stopped mattering; the algorithm decides who sees food content now. Industry-wide benchmark studies put average engagement rates near 3.7% on TikTok, roughly 1–3% on Instagram for food and beverage brands (well above the ~0.5% all-industry Instagram average), and around 0.15% on Facebook — engagement figures from social-analytics vendors (Socialinsider, Rival IQ) that vary by methodology, so treat the ranking as reliable and the decimals as approximate. Food is one of the best-performing content categories on every platform because it is inherently visual.
The practical read for a restaurant:
- TikTok and Reels are discovery engines, not community channels — algorithmic feeds surface strong content from tiny accounts, which favors small venues with good food footage.
- Facebook is a utility profile: hours, menu link, reviews, and targeted local ads. Organic Facebook posting is close to dead as a reach strategy.
- Social proof compounds with reviews. For Gen Z, creator videos function as reviews — which is why TikTok is their #1 discovery channel at 38% (Toast).
Loyalty program statistics: the 7% who pay the bills
Restaurant profitability concentrates in a small, recurring slice of guests, and the data on this is unusually good. The Regulars Report from Toast and Resy (Q1 2026, built on Toast POS transaction data plus a national diner survey) found that as few as 7% of guests can drive up to 50% of a restaurant’s order volume. Regulars — guests visiting three or more times — book 83% of their visits in advance, versus 48% for everyone else.
Independent data agrees on the trend. Circana’s loyalty research found loyalty members now account for 39% of all US restaurant visits — double the share of five years earlier — and members make 22% more restaurant visits per year than non-members. At leading QSR chains, members drive half or more of total visits. Circana’s counterpoint is worth keeping: members enroll in many programs at once (they visit 20 brands a year, same as non-members), so a points program alone doesn’t create exclusivity — recognition and convenience do.
The economics follow directly: with paid customer-acquisition costs rising industry-wide, the highest-ROI marketing budget in 2026 is usually the one aimed at guests you already have — a database you own (email, SMS, ordering history) rather than an audience you rent from Meta or a delivery app. That is the same 0%-vs-30% commission logic covered in our online ordering statistics.
Marketing spend: what restaurants actually budget
The standard planning benchmark is 3–6% of gross revenue on marketing, with new venues spending toward 7–10% while they build awareness. These figures come from industry guidance and vendor surveys rather than audited averages, so treat them as planning ranges. What the harder data supports is the allocation shift: owned and earned channels (reviews, local listings, loyalty, email/SMS) compound, while paid social reach keeps deflating and iOS privacy changes have pushed paid acquisition costs up across every sector.
A useful 2026 sanity check for any restaurant marketing budget, in order:
- Google Business Profile and listings complete and consistent — hours, menu link, photos, exact name and address everywhere.
- Review engine running — ask every guest, respond to everything, protect the 4.5+ average that 31% of consumers now demand.
- Machine-readable menu — indexable HTML with real dish names and prices, so AI assistants can read it (how to make one).
- Owned guest database — loyalty, email, SMS; the 7% who drive half your volume should hear from you directly.
- Short video — only after the above, because discovery without conversion infrastructure leaks.
Disputed and vendor-only statistics to treat with caution
Restaurant marketing runs on recycled numbers, and several of the most-quoted ones don’t survive a source check. The table below flags the claims we could not verify to a primary source, alongside what the verifiable record actually says.
| Claim you’ll see quoted | Status | What the record shows |
|---|---|---|
| “94% of diners read online reviews” | Outdated / untraceable | Traces to a 2018 TripAdvisor-commissioned survey and a ReviewTrackers stat; BrightLocal’s current 2026 figure is 97% for local businesses generally |
| “98% of SMS messages are opened” | Misleading metric | SMS has no universal read receipts; 98% is a visibility assumption, not a measured open rate. SMS click-through rates (measurable) do far outperform email |
| “$1 on influencers returns $5” | No methodology | No rigorous study behind it; influencer ROI depends on trackable codes and is rarely published |
| ChatGPT only recommends 4.3+ star restaurants | Vendor prompt-testing | Uberall/Bloom Intelligence testing observed rating floors (ChatGPT ~4.3, Perplexity ~4.1, Gemini ~3.9), but these are reverse-engineered observations, not documented thresholds |
| “83% of restaurants invisible to AI” | Vendor study, directionally solid | Uberall sells GEO software; the benchmark methodology is public and the direction matches independent adoption data, but treat the exact percentage as vendor-measured |
What this means for your restaurant
The 2026 marketing stack rewards restaurants whose data is readable by machines and whose regulars are reachable directly. The AI-discovery wave is the rare marketing shift where small venues aren’t structurally disadvantaged: AI assistants don’t sell ads yet, and they cite whoever has the cleanest structured data and the strongest recent reviews. A restaurant with a machine-readable menu, a complete Google profile, and a 4.5+ average is competing on even terms with chains for a spot in a 3-to-5-name answer.
Duckhub’s part of that stack is the menu layer: an indexable QR menu your own AI assistant can build with structured dish data, published on the web where both guests and AI crawlers can read it — plus first-party ordering that keeps your guest data yours at 0% commission. You can build one free in about 5 minutes on the free Egg plan, and see the full data picture in our QR code menu statistics and restaurant technology statistics hubs.
All statistics verified against primary sources as of July 2026. Vendor-sourced figures are marked as such throughout. This page is refreshed quarterly — AI-discovery numbers are moving faster than any other metric in this series.